Table of contents
Open Table of contents
Introduction
For the day-to-day work of a Machine Learning Engineer or Data Scientist, it is common to use popular ML frameworks like Scikit-learn, Pytorch, etc. These frameworks provide us with highly optimized implementations of most ML algorithms to use out of the box.
Despite this, it’s a good exercise to try and code some of the basic algorithms from scratch, or using just NumPy. Writing code helps solidify our conceptual understanding of the algorithms, and improves our coding ability. Implementing ML algorithms without using frameworks is also a popular interview exercise. Thus, it’s best to be able to code algorithms such as K-Means, K Nearest Neighbours, Linear Regression and Logistic Regression.
In this post, we’ll implement the K-means clustering algorithm. The code is adapted from multiple sources listed in the references at the bottom, but presented in a way to represent the block-by-block process of coding something relatively complex.
Coding K-Means Clustering
K-means clustering is an unsupervised learning algorithm, which groups an unlabeled dataset into different clusters. The “K” refers to the number of pre-defined clusters the dataset is grouped into.
We’ll implement the algorithm using Python and NumPy to understand the concepts more clearly.
Given:
- K = number of clusters
- X = training data of shape (m, n): m samples and n features
- max_iterations = max number of iterations to run the algorithm for
Plainly, the algorithm entails the following steps:
- Randomly initialize K cluster centroids i.e. the center of the clusters.
- Repeat till convergence or end of max number of iterations:
- For samples i=1 to m in the dataset:
- Assign the closest cluster centroid to X[i]
- For cluster k=1 to K:
- Find new cluster centroids by calculating the mean of the points assigned to cluster k.
- For samples i=1 to m in the dataset:
We will define the needed functions as and when we require them.
import numpy as np1. Randomly initialize K cluster centroids
As a starting point, we’ll initialize the K cluster centoids by picking K samples at random from the dataset X.
Note that this method of initialization can result in different clusters being found in different runs of the algorithm. The clusters will also depend on the location of the initial centroids.
A smarter initialization mehtod, which produces more stable clusters, while maximizing the distance between a centroid to other centroids is the k-means++ algorithm. We won’t be covering it here, but feel free to read up on it. K-means++ is the initialization algorithm used in Scikit-learn’s implementation.
# randomly initializing K centroid by picking K samples from X
def initialize_random_centroids(K, X):
    """Initializes and returns k random centroids"""
    m, n = np.shape(X)
    # a centroid should be of shape (1, n), so the centroids array will be of shape (K, n)
    centroids = np.empty((K, n))
    # pick indices of K samples, with replacement, from the training data
    centroid_indices = np.random.choice(range(m), size=K, replace=False)
    for i in range(K):
        centroids[i] =  X[centroid_indices[i]]
    return centroids
2. Calculate euclidean distance between two vectors
In order to find the closest centroid for a given sample x, we can use Euclidean Distance between a given centroid and x.
The euclidean distance between two points, p and q in Euclidean n-space is given by the formula:
This can be adapted by thinking in terms of two vectors x1 and x2:
def euclidean_distance(x1, x2):
    """Calculates and returns the euclidean distance between two vectors x1 and x2"""
    return np.sqrt(np.sum(np.power(x1 - x2, 2)))
We can also use the calculate the same by taking the L2 norm of the difference between the two vectors. This can be accomplished using NumPy:
np.linalg.norm(x1 - x2)3. Finding the closest centroid to a given data point
We can find the closest centriod for a given data point by iterating through the centroids and picking the one with the minimum distance.
def closest_centroid(x, centroids, K):
    """Finds and returns the index of the closest centroid for a given vector x"""
    distances = np.empty(K)
    for i in range(K):
        distances[i] = euclidean_distance(centroids[i], x)
    return np.argmin(distances) # return the index of the lowest distance
4. Create clusters
Assign the samples to closest centroids to create the clusters:
def create_clusters(centroids, K, X):
    """Returns an array of cluster indices for all the data samples"""
    m, _ = np.shape(X)
    cluster_idx = np.empty(m)
    for i in range(m):
        cluster_idx[i] = closest_centroid(X[i], centroids, K)
    return cluster_idx
5. Compute means
Compute the means of cluster to find new centroids.
NumPy axes can be tricky if you’re just starting out. This article is an excellent refresher.
def compute_means(cluster_idx, K, X):
    """Computes and returns the new centroids of the clusters"""
    _, n = np.shape(X)
    centroids = np.empty((K, n))
    for i in range(K):
        points = X[cluster_idx == i] # gather points for the cluster i
        centroids[i] = np.mean(points, axis=0) # use axis=0 to compute means across points
    return centroids
6. Putting everything together
Let’s build a function that can run the K-means algorithm for the required number of iterations, or till convergence.
def run_Kmeans(K, X, max_iterations=500):
    """Runs the K-means algorithm and computes the final clusters"""
    # initialize random centroids
    centroids = initialize_random_centroids(K, X)
    # loop till max_iterations or convergance
    print(f"initial centroids: {centroids}")
    for _ in range(max_iterations):
        # create clusters by assigning the samples to the closet centroids
        clusters = create_clusters(centroids, K, X)
        previous_centroids = centroids
        # compute means of the clusters and assign to centroids
        centroids = compute_means(clusters, K, X)
        # if the new_centroids are the same as the old centroids, return clusters
        diff = previous_centroids - centroids
        if not diff.any():
            return clusters
    return clusters
7. Testing it out
To test our implementation, we can use Scikit-learn’s make_blobs function.
from sklearn import datasets
# creating a dataset for clustering
X, y = datasets.make_blobs()
y_preds = run_Kmeans(3, X)
8. Plotting the results
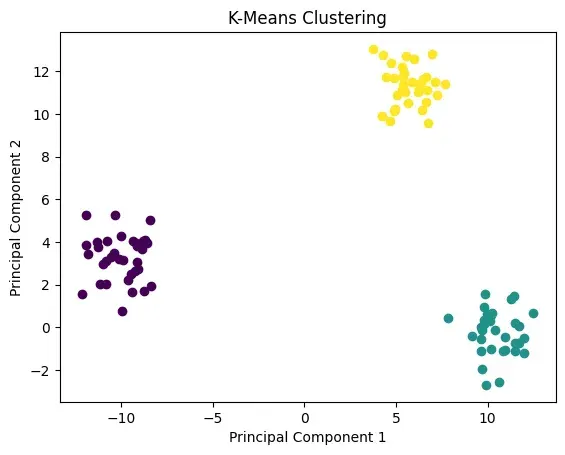
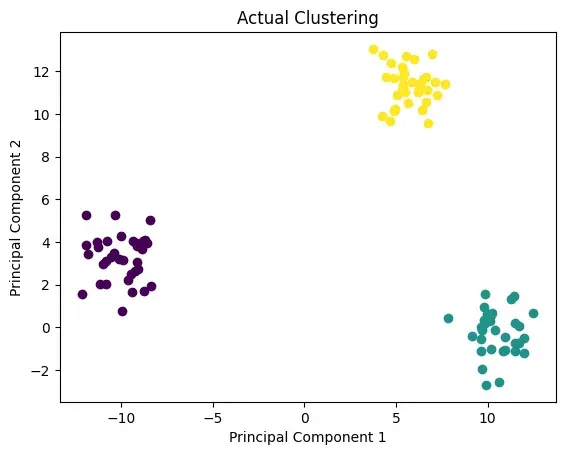
To plot the clusters in 2D, we can use the plotting function from ML-From-Scratch Github repository. We’ll plot the clusters calculated by our implementation, and the ones returned by Scikit-learn.
from mlfromscratch.utils import Plot
p = Plot()
p.plot_in_2d(X, y_preds, title="K-Means Clustering")
p.plot_in_2d(X, y, title="Actual Clustering")

Again, the clusters can depend on the initialization points of centroids, but this time it looks like our implementation was able to find the correct clusters.
Summary
In this post, we saw how we can implement K-means clustering algorithm from scratch using Python and NumPy. Be sure to brush up other concepts and implementation before giving your next ML interview!
References
- ML From Scratch - An excellent Github repository containing implementations of many machine learning models and algorithms. Easy to understand and highly recommended.
- Code ML Algorithms from Scracth - A good blog post similar to this one, echoing the sentiment that this type of exercise is common in ML interviews.